


FINANCIAL REWARDS – GRAPHICS
Additionally, for data analysis about an activity within a company, we offer you a tool “Financial achievement” graphics:
4 types of graphics are offered:
The total agency’s turnover
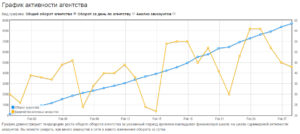
Two curves are drawn on a graphic:
- A total agency’s turnover
- A number of active accounts
A turnover of agency per day
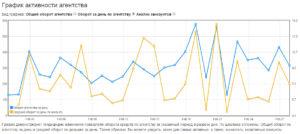
The two curves are applied on the graphic:
- A turnover per day.
- An average turnover of account per day.
The total turnover of accounts
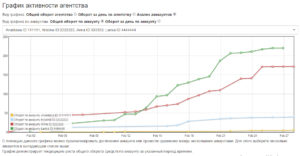
An account’s achievements can be analysed or a comparison between several accounts can be conducted with a help of this graphic. To do it, choose several accounts in a drop-down list above. The graphic demonstrates a tendency of change of turnover means indicator about an account for a specified period during a day.
Общий оборот по аккаунтам
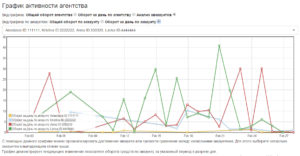
With a help of this graphic you can track a tendency of turnover means changes about an account per day. Every day a curve will be changing and it will show a sum of sent activity. Also, you can compare activity of accounts between themselves for more visual analytics.
Have a nice chat.
Sincerely, the ChatOS team!
